Description
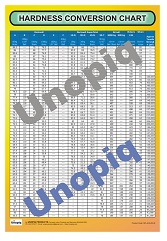
The above image is only a preview. This Hardness Conversion Chart poster is a quick reference tool. It helps you compare hardness values across common test scales. It supports Rockwell, Brinell, and Vickers conversions in one view. Therefore, teams can interpret results faster. Moreover, it reduces confusion during inspection and reporting. As a result, decisions become consistent across shifts. Also, the poster supports better communication between QA, production, and suppliers.
This poster is designed for practical use at the workplace. It helps when drawings specify one scale. It also helps when certificates arrive in another scale. Consequently, you avoid time loss during cross-checking. Additionally, the chart supports faster discussion with customers. It also supports more confident acceptance of material lots.
Key uses the poster supports:
• Converting hardness values for comparison and reporting
• Aligning supplier test reports with internal specifications
• Supporting incoming inspection and material verification
• Assisting heat treatment review and process monitoring
• Reducing errors in inspection notes and COA checks
Who can use this poster?
This poster is useful in many industries dealing with metals. It is also useful wherever hardness testing is common. Therefore, it suits both shop floors and laboratories. Moreover, it supports training and skill development.
Ideal users and placement areas:
• Quality control teams and inspectors
• Metallurgy labs and heat treatment shops
• Manufacturing engineers and production supervisors
• Machine shops handling hardened components
• Foundries and forging units verifying properties
• Supplier development and vendor audit teams
• Technical institutes and training classrooms
It also fits near hardness testing machines. It works well near material storage areas. It also fits near inspection desks and QA boards.
Why is it useful?
Hardness values are easy to misinterpret across scales. However, decisions often depend on quick comparison. This poster solves that daily gap. Therefore, you reduce guesswork and avoid delays. Moreover, it supports standard work in inspection. As a result, you reduce rework and disputes. Also, your documentation becomes clearer and more consistent.
Practical benefits you can expect:
• Faster comparison of test results across scales
• Better alignment between customer and supplier requirements
• Reduced time spent searching reference tables
• Improved accuracy in inspection records and reports
• Better communication during audits and reviews
• Stronger confidence during acceptance decisions
Good practice tips for best results:
• Use the chart as a reference, not as a substitute
• Confirm the base material and test method used
• Use calibrated equipment and approved procedures
• Record the original scale along with the converted value
• Verify critical cases using standards and lab confirmation
Specifications:
• Size: 13″ x 19″
• Finish: Soft laminated
• Material: 300 GSM board
Safety and legal disclaimer:
Unopiq Products posters are for general reference and awareness only. Conversions can be approximate and material-dependent. This poster does not replace standards, lab procedures, or professional judgment. Always follow your organization’s inspection method and acceptance criteria. Unopiq Products is not responsible for failures, disputes, losses, or damages arising from misuse or incorrect interpretation.